
12 Jul Nine Easiest to Use Graph Makers Online
These days, people get bored quickly. That’s why you can’t use huge blocks of texts for your presentation or website and expect them to stay focused. In such situations, a reliable graph maker can help you.
Whether you’re new to making graphs or you want to make the process stress-free, here are nine online graph creators you’ll find easy to use.
Table of Contents
1. Chartblocks
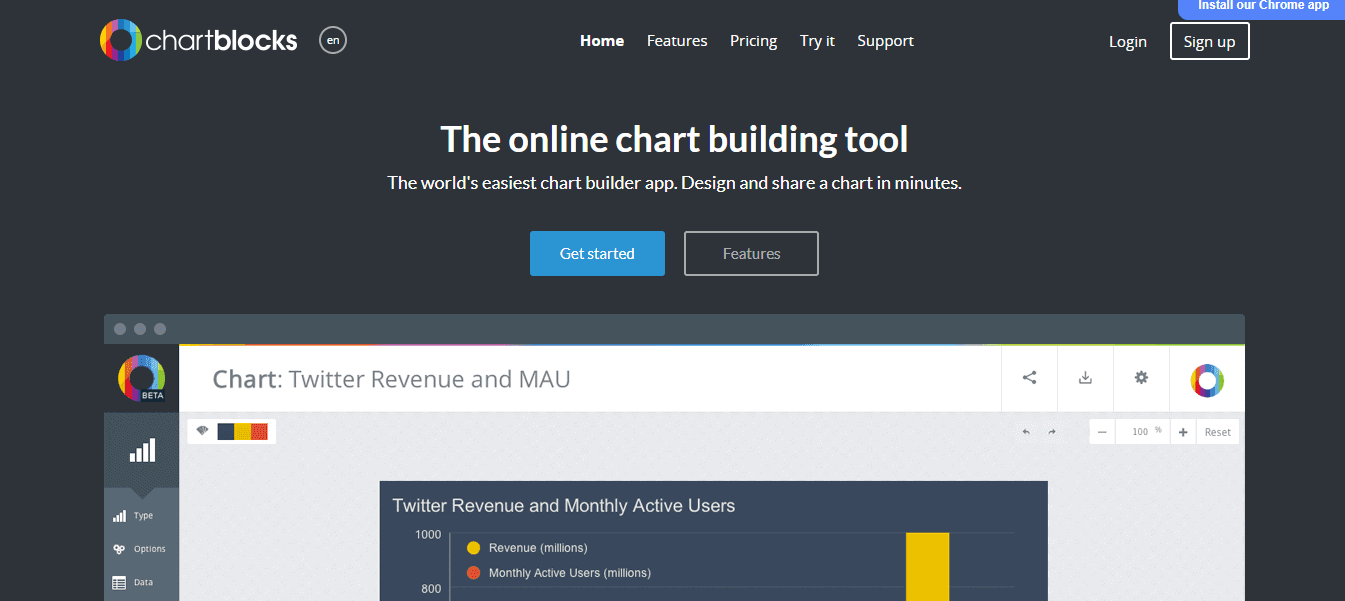 Chartblocks allows users to design their charts by importing data straight from their databases and spreadsheets. If you don’t have them in those formats, don’t worry. There’s always the option to enter your information manually.
The graphs you make with this tool can adapt to any device or screen size. And if you have social media or a website, you can embed your charts there. Also, the tool comes with a free personal plan and allows users to create as many as 50 graphs.
However, you might want to consider getting a professional plan if you wish to access more features.
2. Adobe Spark Graph Maker
 If you aren’t that confident with your skills in designing or you don’t know how to make graphs, this tool is for you. Belonging to the Adobe company, Adobe Spark Graph Maker lets you create four different chart types for your presentations.
First, there’s the donut, bar, line, and circle chart. All of which are relatively easy to customize to fit your needs.
3. ChartGo
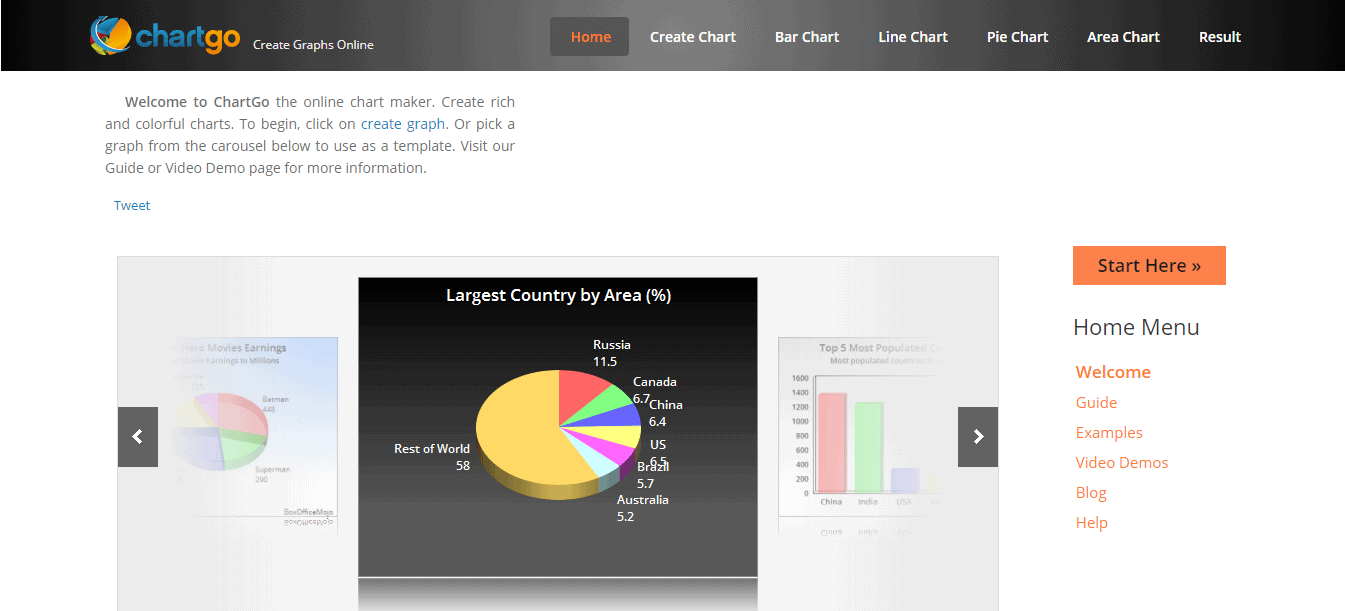 ChartGo is excellent for beginners since it comes with templates. If you aren’t experienced in making rich and colorful charts, you can pick one from its designs and use it as a template for your presentation.
Additionally, there’s no need to retype your data with this tool. You won’t even have to cut and copy-paste them. Instead, you can upload your excel file, and it will automatically generate a chart for you.
4. Plotly
 With this online graph generator, you can create interactive charts for your audience. To use it, all you need to do is upload your information and customize the layouts, legends, notes, and axes based on what your presentation needs.
Plotly lets users generate up to 50 private files. It can also allow people to collaborate on graphs. Furthermore, the tool requires no installation, and you can save your files in different formats, like PDF, EPS, and SVG.
5. Infogram
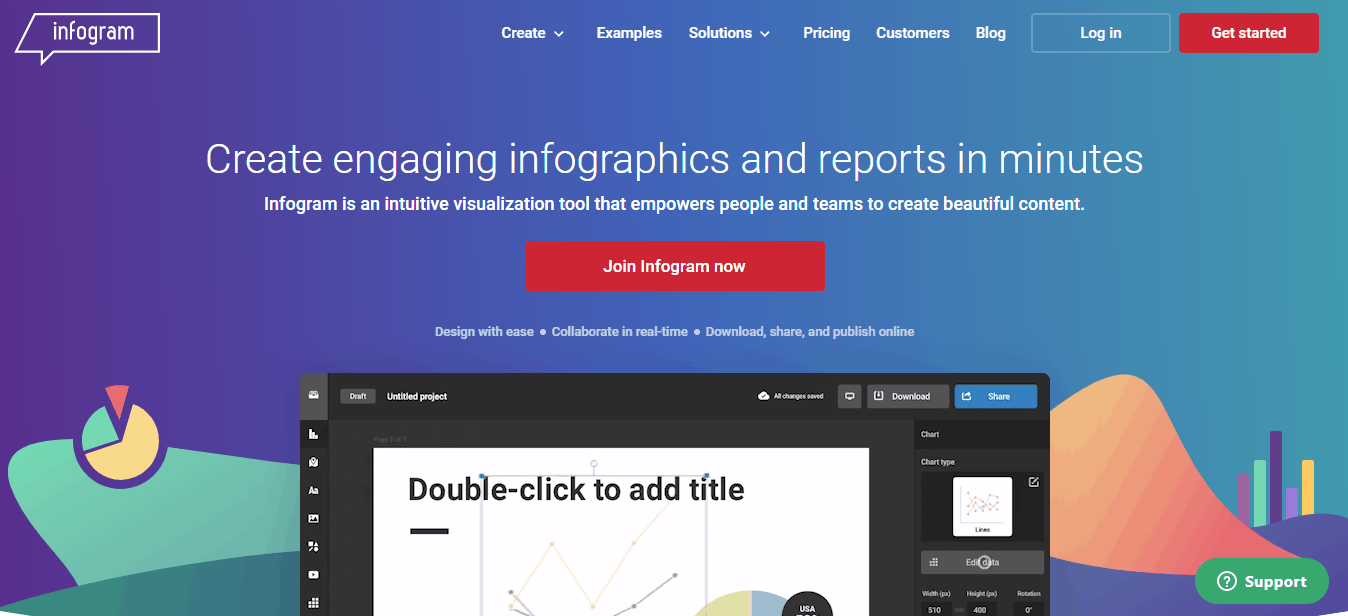 This graph maker allows users to generate beautiful content quickly and easily. Since it supports several data sources, you can import your data from Google Drive or Dropbox, and you’re good to go.
Moreover, Infogram has a free version to allow users to give it a try first. Even if you choose the free option, you can still create interactive goals.
However, if you need graphs in different formats, like PDF and PNG, you may need to get the paid versions. The free version only supports SNS formats.
6. Live Gap
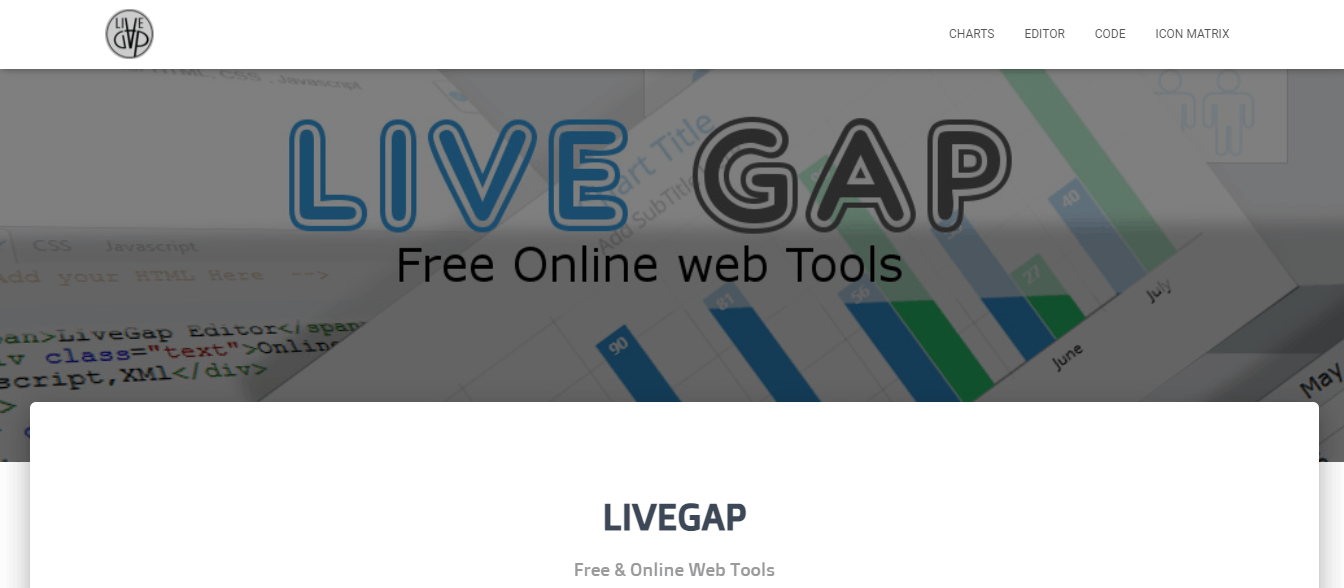 Live Gap is exclusive for making graphs. It’s a popular choice online since there’s no need to install it on devices. You can even use it without going through the whole registration process.
Take note that if you want to save a copy of your graph online, you may need to register. Live Gap has a simple UI which makes it easy to use even for beginners. It only involves three panels which are used for setting styles, displaying charts, and inputting data.
Like most online graph generators on this list, this one allows users to enter their data manually. However, you can also copy them from your spreadsheet or Excel if necessary.
7. Online Chart Tool
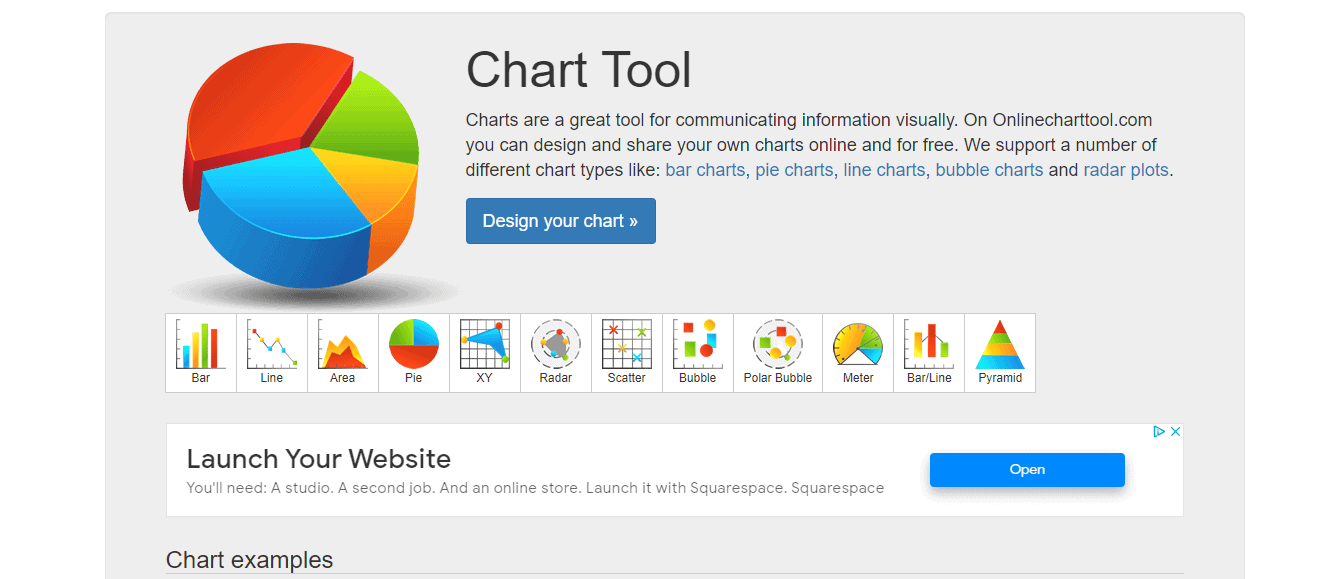 Online Chart Tool is a basic graph generator. You won’t need to familiarize yourself with complicated tools to make a graph. And the best part? It’s free.
The first step involves selecting the type of chart you want to create. Then, after adding your data, the next step is to pick the labels and fonts.
Finally, the tool allows you to see the chart you’ve made before saving or sharing it. If you spot an error, you can quickly go back.
8. Gliffy

Even a novice can use this tool. Its interface is straightforward to understand since it has a drag and drop feature. Furthermore, the Gliffy generator allows multiple users to collaborate on a single project. It makes editing and doing final touches easy and seamless.
Gliffy also makes it possible to review changes with its revision history feature. With it, you can look back on and change parts as needed.
9. FineReport
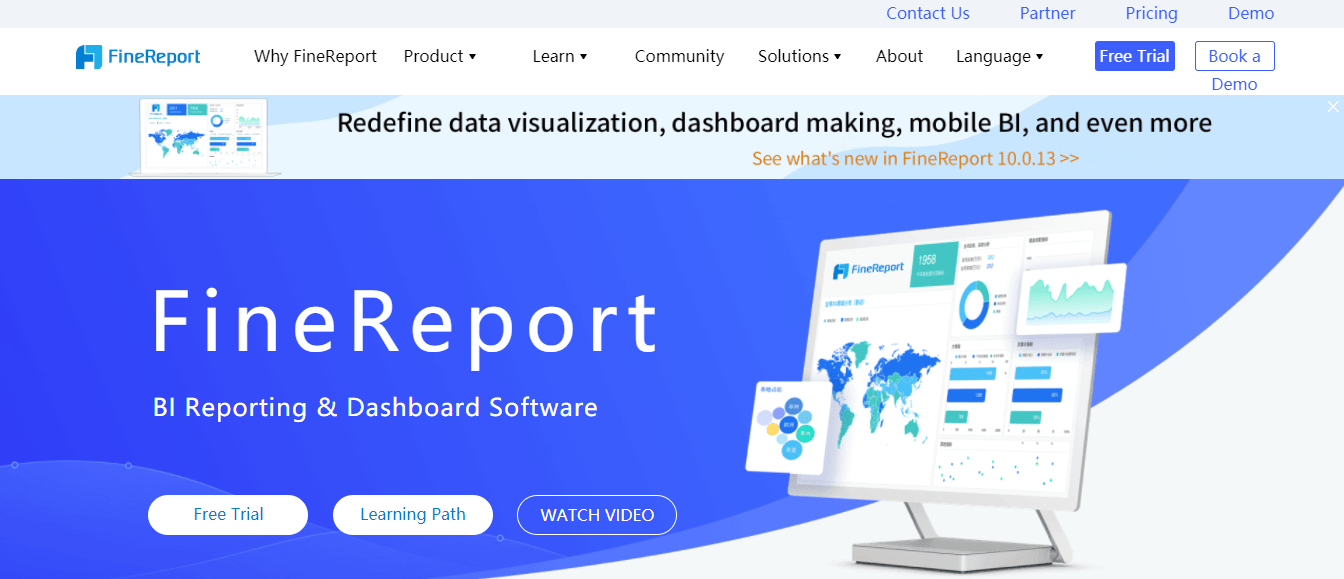 This tool lets users make basic and advanced charts easily. Like most tools on this list, it also supports different data sources like Excel.
FineReport comes with a free version that doesn’t have time or feature restrictions. It also has a quote-based plan which they recommend for business users.
One of the nice things about this online graph maker is the live demo their experts offer their customers. With it, people can determine if it’s the right chart generator for them and their business.


No Comments